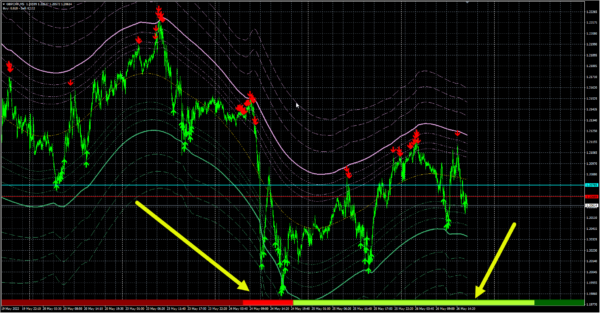
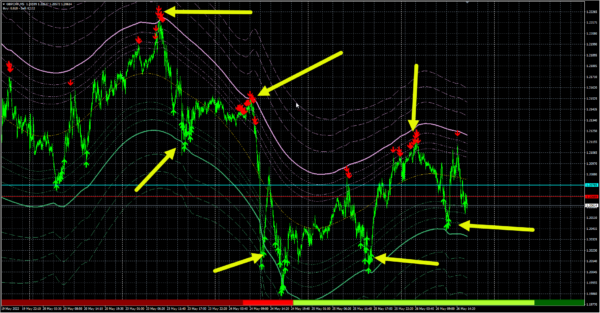
- Estimate the level of possible price return
- Show market trends in all time frames in curves form
- Estimate supply and demand strength
- Estimate risk situations to prevent trading
- Estimation of short and long signals
This indicator is designed for scalp trades in 1 and 5 minute time frames. Of course, it can be used in other time frames with very reliable estimation.
Trend curves
These curves consist of four different sections, which are marked with the letters A to D in the image.
Curve A:
This curve shows the overall balance of supply and demand in the market. You should not open any trade when the price is close to this curve.
Curve C:
This curve includes the upper curve C1 and the lower curve C2.
- If the curve has a positive slope, and the price is next to C2, you can enter the long position with a good risk.
- If the curve has a positive slope and the price is next to the C1 curve, it is better Not to take any position.
- If the curve A slope is close to zero over a period of time; If the price is next to the C1 curve, the short position can be opened, and if it is next to the C2 curve, the long position can be opened.
- If the slope curve has a negative slope and the price is next to the C1 curve, the short position can be opened with a suitable risk.
- If the curve has a negative slope and the price is next to the C2 curve, it is better Not to take any position.
Curve B:
Curve B: These curves consists of three upper curves B1 and three lower curves B2.
The curves of the B series are similar to the curves of C. The only difference is that they have less power than the C-curve.
The closer the B-series curves are to its C-sided curve, the more resistance and support it will have.
Curve D:
D curves also include three D1 curves at the top and three D2 curves at the bottom.
When the price enters this range, the market is emotional and we should avoid entering the trade.
If in the range of these two series of curves, the price returns to the area between two curves with a powerful candlestick, the position in direction of the candlestick can be opened.
If the process of returning the candlesticks to the area between two C-curves is done slowly, one of the conditions should be avoided before entering the trade.
The power of buyer and seller
At the bottom of the window you will see two red and green bars. These two power bars show the market’s inherent tendency to demand or supply.
These strips fill the entire width of the trading window in two directions, dark green and dark red, which are the ultimate strengths on both sides of the market.
Bright green and bright red bars are the estimated amount of power of buyers and sellers and the strength of the tendency to buy and sell in the market.
If this bar tends to green, the demand side has more power, and if this bar tends to red, it has more supply side.
Absorbent price
Absorbent price is the price at which candlesticks tend to converge.
You should note that the price of the absorber is constantly changing according to supply and demand conditions. The conditions of this price and candlesticks have two modes in relation to each other.
If there is no drastic change in the power of supply or demand, the market price will move towards the absorber price.
If there is a drastic change in the power of supply or demand, the absorber price will approach the market price.
So if the difference between the absorber price and the market price increases, we should expect a trend; Depending on the conditions, either this trend will be from the market price to the blue line of the absorbent price, or vice versa, we will see the movement of the absorbent line towards the market price. If the first case can be profited by opening a position to move the market price; But if the second case is observed, no new position should be opened.
Buy and sell signals
According to the results of different models of candle patterns and different indicators, as well as the estimated supply and demand conditions, a set of arrows in the direction of shorts or bay positions is displayed.
The higher the density of these signal flashes, the more likely The signal will be successful.
- Do not open the position at all before announcing the important news and do not open the new position for a few minutes after announcing the news.
- Never trade in opposite direction of the market unless you have complete control over the indicator and its trading system.


